This event was observed before the general nature of FTE's was known and represents a very significant event. We can see from the geocentric planetary position map below that the moon was applying to critical aspects between itself and the Sun and to Neptune. The moon applying 60 degrees 27 minutes to Neptune and even closer to a the critical 75 degree angle to the sun at 75 degrees 14 minutes. Flux Transfer Event magnitude increases as critical angles are formed between the moon and the sun and planets. FTE's occur every 8 minutes and their magnitude varies by the influences of several interplanetary factors and the level of activity on the sun. The levels of activity on the sun as can be seen on the page on this website covering the cattle cycle and planetary and solar cycles. The level of the intensity of these events is directly related to the relative angles of Jupiter and Saturn to the galactic centre. Voyager data shows that the flux transfer events energy originates in the interstellar medium.


This second study of another historical FTE is also a very powerful;; event. We can see from the planetary geocentric position map that once again the moon was applying at a critical angle to Neptune. This time it the moon was applying to the 120 degree angle to Neptune at 120 degrees 28 minutes.  

A study of all the published magnetic storms that had potential to disrupt satellites, or power grid systems that was published by the NOAA for June 1st to August 31st, 2014 43 out of 52 events for the period occurred when either the moon, or one of the planets was applying towards an aspect of the 24th harmonic. Of the events that had the closest aspect being a separating one, two of these were within one acrminute of the nearest applying aspect. This is when two planets are separated by an angle divisible by 15. The probability that an aspect that is the closest is applying towards the perfect angle for any random event is 50%. These observations then suggest that this effect is far from random. The slide show below is of the planetary positions and angles during each magnetic storm. 


The physical process that creates connections between the magnetic fields emanating from the Sun and a planet - a process known as magnetic reconnection - creates a portal through which solar plasma can penetrate the planetary magnetic field. The opening of these portals, known as flux transfer events (FTEs), takes place roughly every 8 minutes at Earth and spawns a rope of streaming plasma.

As early as 1985, scientists analyzing the Mariner 10 observations, collected during their 1974 and 1975 flybys, have known that FTEs also occur at Mercury.

However, using the measurements returned from the MErcury Surface, , and Ranging (MESSENGER) spacecraft now orbiting Mercury, Slavin et al. find that Mercurial flux transfer events are proportionally much larger, stronger, and more frequent than those at Earth.

Over a 25-minute period on 11 April 2011, MESSENGER detected 163 FTEs near the Mercurial magnetopause. The individual events took 2 to 3 seconds to move past the spacecraft, and the events were separated by 8 to 10 seconds.

Using a model of FTE motion, the authors find that the FTEs were likely initiated near the planet's southern magnetic pole before traveling to MESSENGER's location at the nightside magnetopause.

Modeling the changes in  observed as the FTEs passed over MESSENGER, the authors determined that the FTEs had elliptical cross sections with a mean semimajor axis of about a sixth of the radius of Mercury.

The authors suggest that if MESSENGER had not orbited out of the path of the events emanating from the southern magnetic pole, then FTEs likely would have continued to be detected until the interplanetary magnetic field conditions became unfavorable for reconnection.

Other observations of flux transfer events: As early as 1985, scientists analyzing the Mariner 10 observations, collected during their 1974 and 1975 flybys, have known that FTEs also occur at Mercury.

However, using the measurements returned from the MErcury Surface, , and Ranging (MESSENGER) spacecraft now orbiting Mercury, Slavin et al. find that Mercurial flux transfer events are proportionally much larger, stronger, and more frequent than those at Earth.

Over a 25-minute period on 11 April 2011, MESSENGER detected 163 FTEs near the Mercurial magnetopause. The individual events took 2 to 3 seconds to move past the spacecraft, and the events were separated by 8 to 10 seconds.

Using a model of FTE motion, the authors find that the FTEs were likely initiated near the planet's southern magnetic pole before traveling to MESSENGER's location at the nightside magnetopause.

Modeling the changes in  observed as the FTEs passed over MESSENGER, the authors determined that the FTEs had elliptical cross sections with a mean semimajor axis of about a sixth of the radius of Mercury.

The authors suggest that if MESSENGER had not orbited out of the path of the events emanating from the southern magnetic pole, then FTEs likely would have continued to be detected until the interplanetary magnetic field conditions became unfavorable for reconnection.

Addition research on FTE's : http://www-ssc.igpp.ucla.edu/personnel/russell/papers/sourceflux(4)/

Plasma wave observations from Voyager 1 have recently shown large increases in plasma density, to about 0.1 cm^{-3}, consistent with the density of the local interstellar medium. However, corresponding magnetic field observations continue to show the spiral magnetic field direction observed throughout the inner heliosheath. These apparently contradictory observations may be reconciled if Voyager 1 is inside an interstellar flux transfer event - similar to flux transfer events routinely seen at the Earth's magnetopause. If this were the case, Voyager 1 remains inside the heliopause and based on the Voyager 1 observations we can determine the polarity of the interstellar magnetic field for the first time.

Here is link for a NASA video on the  X-points: http://www.disclose.tv/action/viewvideo/145354/NASA_DISCOVERS_HIDDEN_PORTALS_BETWEEN_THE_EARTH_AND_THE_SUN/

Most geomagnetic storms appear to coincide with lunar aspects. Take a look at this one. Moon sextile Venus

Brian Johnston's photo.
Like

Here is another set of small storms. This is mostly leading up to the moon sexile to the sun. There is also activity at the end due to moon 165 degrees to Pluto.

Brian Johnston's photo.

By observing the geomagnetic storms I think I solved a problem that has vexed me for about 40 years. Why are the critical angles we call aspects important and how do they work?

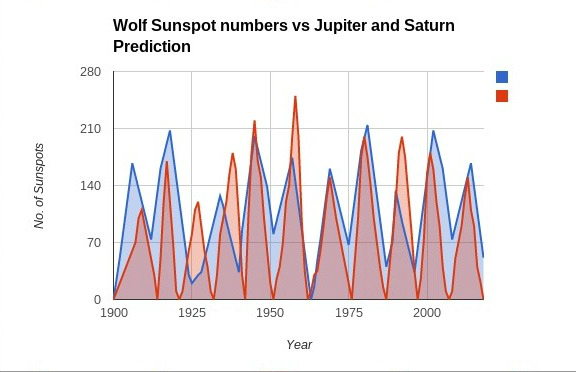
When I looked at the solar cycle and the positions of Jupiter and Saturn as related to the center of the galaxy it projected an almost prefect prediction of the rate of storms on the sun. The aspects between the planets really did not matter, rather it was the sum of the sine of the angle of the planet to the centre of the galaxy times the relative mass of the planet. This is straight electrical physics.

Why then do we see an effect upon the geomagentic storms and the aspects of the planets and also when there are earthquakes?

It appears that the answer is also electrical. I was looking at a bunch of electrical phase angle equations and I realized that a standing wave might work. As the experimental results showed that the critical angle was the centre of the galaxy at 270 degrees ecliptic longitude. I started a standing wave at that point with a wavelength of 15 degrees. I then phase shifted the angles and it worked perfectly. In fact, however, the standings waves for aspects are reflected directly off the planets involved in the aspect themselves.

The geomagnetic storms are caused by cascades of electrons pouring out of X-points, electron diffusion regions, which are the mechanisms of the flux transfer events. The magnetic filed of the earth and the sun intermingle and create the X-points. It is apparent that the cascades vary in intensity and that they work similar to what is known as a silicon controlled rectifier. When a certain level of potential the SCR fires and discharges a large current of electricity.

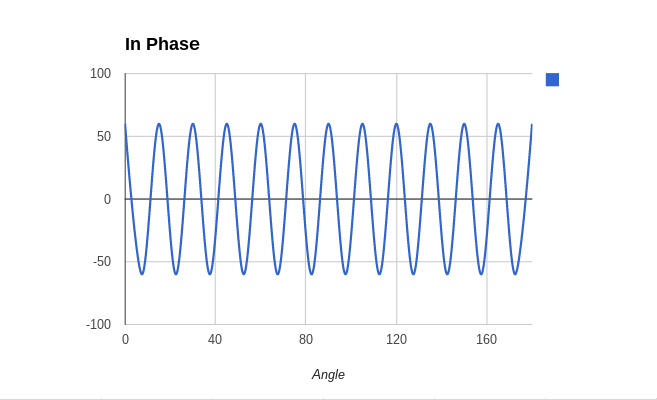
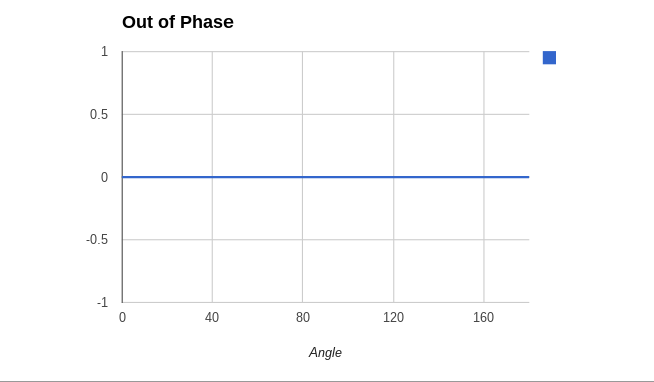
From this I simulated a trigger level and compared it to the standing wave which I had created which acted like the aspects. When these two are combined it illustrates how the aspects work, why events tend to occur before an aspect and the reason why critical angles are important.

The one graph below shows the out of phase condition where the orb of the aspect is 7.5 degrees. The next graph shows when the exact aspects are being made, or in phase and the third shows the alignment of the flux transfer events and their timing by the aspects. The actual threshold level is actually much closer to the actual timing of the aspect. The magnitude would vary by the stimulus of the mutual planetary aspects and the level of sunspot activity. I have also attached the sunspot correlation graph.


The video below is of an CME on September 10th, 2014. It occurred as Mercury approached the semi square of Mars and sextile of Jupiter, just exiting from the square of Pluto. This appeared to create the electrical potential for the event, What seems to be happening is that the earth is acting like an SCR and firing accelerated electrons along the conduit that exists between the earth and the sun at near the speed of light. This then causes an X-point to form on the sun and then there is at times a massive flux transfer event which results in a CME. The Moon was square to Pluto at 1:37 EDT and this seemed to act as the trigger to fire the SCR-like stream of electrons to trigger the coronal mass ejection. 

The planetary map below is for the time when the moon squared Pluto. 

Here's another view of the event. Notice the shock wave that goes across the surface of the sun near the start of the event.  

The geomagnetic storms create the aurora at the poles of the earth. The video below shows the relationship between the origins of the aurora and the eventual flux transfer events high in the earth's magnetic field. 

From the research that I have done with the solar storms, the planetary aspects and the geomagnetic storms I have been ale to come up with a circuit as to how the system works based upon electronics. The symbols L1, R1, and C1 through L6 etc., are the respective magnetic fields of the Planets Neptune, Uranus, Saturn Jupiter, The Earth and the Sun. The circles with the symbols inside are transistors representing the planets and the sun. The funny looking symbols near the top are the variations in the planetary field caused by the planetary aspects. The rest of the symbols marked with R is the resistance of the space between the planets. The Symbols marked with C is charge that is built up by the individual planets and the sun. The arrow shaped objects are the flux transfer events with feedback loops between the sun and the various planets. They are connected to the sun via the electro-magnetic conduits. The lines at the top with the +/- sign is the potential magnetic moment difference between the sun and the surrounding galactic field. As a ciruit diagram can be easily converted into a physics formula and the way the circuit woks can be analysed by boolian algebra then all that has to be done, more of lees is to fill in the blanks, so to speak and see how the system works physically and mathematically too account for the observed effect upon the solar storms and their effect on the climate of the earth.

If you built this circuit it would be very volatile and would vibrate violently and would be capable of large periodic discharges.

The symbols L1, R1, and C1 through L6 etc., are the respective magnetic fields of the Planets Neptune, Uranus, Saturn Jupiter, The Earth and the Sun. The circles with the symbols inside are transistors representing the planets and the sun. The funny looking symbols near the top are the variations in the planetary field caused by the planetary aspects. The rest of the symbols marked with R is the resistance of the space between the planets. The Symbols marked with C is charge that is built up by the individual planets and the sun. The arrow shaped objects are the flux transfer events with feedback loops between the sun and the various planets. They are connected to the sun via the electro-magnetic conduits. The lines at the top with the +/- sign is the potential magnetic moment difference between the sun and the surrounding galactic field. As a ciruit diagram can be easily converted into a physics formula and the way the circuit woks can be analysed by boolian algebra then all that has to be done, more of lees is to fill in the blanks, so to speak and see how the system works physically and mathematically too account for the observed effect upon the solar storms and their effect on the climate of the earth.  

Q1 is Neptune, Q2 is Uranus, Q3 is Saturn, Q4 is Jupiter, Q5 is the Earth and Q6 is the Sun. The electrical potential of the sun is approximated as 2x10ee13 volts. The capacitance of the earth, it's ability to hold a charge is about 5x10ee8 Farads. The evidence that the earth holds a charge is the ionosphere whose existence has remained unexplained up until the present time. This would represent the one plate of a capacitor and the surface of the earth the other plate. This is true of all the planets and the sun. The exact values for the other planets still has to be worked out.

The way it works is that the magnetic fields cascade down from the outer planets to the earth while remaining also connected to the sun. The triangle shapes are Zener diodes which allow flow through them in one direction until the potential builds up to a certain point when the resistance breaks down and there is an electrical cascade in the opposite direction. This is the flux transfer events. The planetary aspects act as regulators that vary the electrical flow between the planets and to the the Sun.

It sort of works like an electrical gun. The various planets cascade from the outer solar system through each of the major planets and then finally to the earth which then acts like the barrel of the gun which fires at the sun. This what causes the variations in the sunspot cycle. As Jupiter and Saturn revolve around the sun they either amplify, or attenuate the flow from the sun to the galactic medium. There are travelling waves between the planets and when the planets reach an aspect the waves amplify each other and create an event. When they are half way between aspects they attenuate the waves and this then cancels the effects out.

For the sunspot cycle if there is a conjunction of Jupiter and Neptune after the conjunction of Jupiter and Saturn then the waves reflect off of Neptune and this causes an inversion of the wave. This happened in 2009 and this is what has resulted in the delay of the onset of the present sunspot cycle and will cause an extended period of global warming over the next five years. The peak of this sunspot cycle has also been elongated and we have also seen a reversal of the magnetic polarity of the sun over the last few weeks, as would be expected.

As far as the earth's climate in general, which reacts in a variety of ways to these cycles, when Saturn conjuncts Uranus the waves reflect off of Uranus and invert the wave which affect the polarity of the changes in the temperature of the Northern Hemisphere. The Southern Hemisphere temperature changes are directly linked to the 22 year sunspot cycle, while the Northern Hemisphere is more closely linked to the 11 year sunspot cycle.


There may be more slight changes to the circuit as my understanding of it's operations improve.

The animation below shows how a reflected wave reverses its'polarity. 

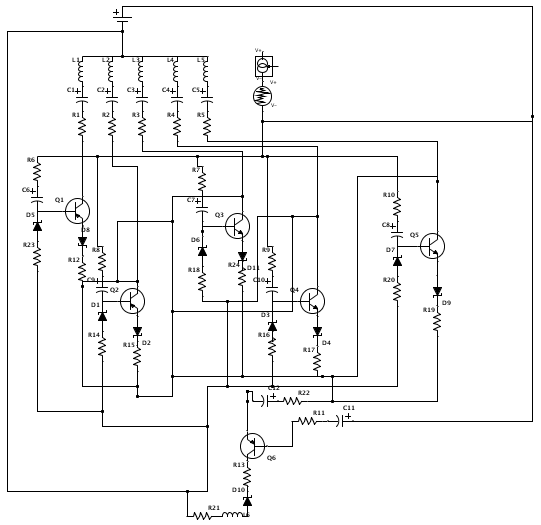
Animated diagram showing the operation of a tuned circuit (LC circuit). The capacitor stores energy in its electric field E and the inductor stores energy in its magnetic field B (green). This jerky animation shows "snapshots" of the circuit at progressive points in the oscillation. The oscillations are slowed down; in an actual tuned circuit the charge oscillates back and forth tens of thousands to billions of times per second. 

The animation below shows how the travelling waves between the planets interact during aspects. 


Resonance effect

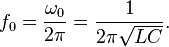
The resonance effect occurs when inductive and capacitive reactances are equal in magnitude. The frequency at which this equality holds for the particular circuit is called the resonant frequency. The resonant frequency of the LC circuit is

\omega_0 =   {1 \over \sqrt{LC}}

where L is the inductance in henries, and C is the capacitance in farads. The angular frequency \omega_0\, has units of radians per second.

The equivalent frequency in units of hertz is

f_0 = { \omega_0 \over 2 \pi } = {1 \over {2 \pi \sqrt{LC}}}.

LC circuits are often used as filters; the L/C ratio is one of the factors that determines their "Q" and so selectivity. For a series resonant circuit with a given resistance, the higher the inductance and the lower the capacitance, the narrower the filter bandwidth. For a parallel resonant circuit the opposite applies. Positive feedback around the tuned circuit("regeneration") can also increase selectivity.

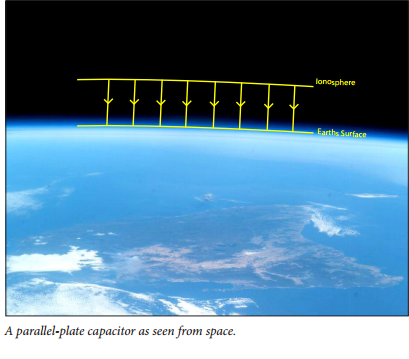
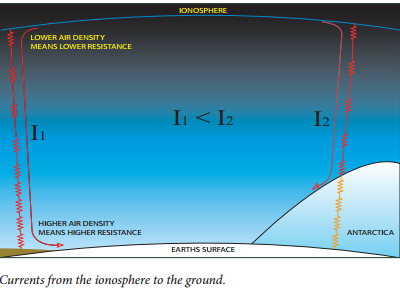
In the illustration the coil represents the earth's magnetic field, The resistor represents the resistance of the conduit between the earth and the sun. The capacitor represents the stored charge of the field. 

A series RLC circuit: a resistor, inductor, and a capacitor


We have also established a relationship between the planetary aspects and the timing and rate of earthquakes. How do these two natural phenomena then link together. Read the following excerpts regarding this issue which show the that the researchers inthis area have found that earthquakes are also being created through vast electronic systems. : In the Journal of Scientific Exploration, Vol. 17, No. 1, pp. 37–71, 2003, there is an excellent report that addresses the more down-to-earth problems facing geophysicists trying to understand earthquakes. The paper is titled, Rocks That Crackle and Sparkle and Glow: Strange Pre-Earthquake Phenomena, by Dr. Friedemann T. Freund, a professor in the Department of Physics, San Jose State University, and a senior researcher at NASA Ames Research Center. Dr. Freund writes:

“Many strange phenomena precede large earthquakes. Some of them have been reported for centuries, even millennia. The list is long and diverse: bulging of the Earth’s surface, changing well water levels, ground-hugging fog, low frequency electromagnetic emission, earthquake lights from ridges and mountain tops, magnetic field anomalies up to 0.5% of the Earth’s dipole field, temperature anomalies by several degrees over wide areas as seen in satellite images, changes in the plasma density of the ionosphere, and strange animal behavior. Because it seems nearly impossible to imagine that such diverse phenomena could have a common physical cause, there is great confusion and even greater controversy.”

Freund outlines the basic problem:

“Based on the reported laboratory results of electrical measurements, no mechanism seemed to exist that could account for the generation of those large currents in the Earth’s crust, which are needed to explain the strong EM signals and magnetic anomalies that have been documented before some earthquakes. Unfortunately, when a set of observations cannot be explained within the framework of existing knowledge, the tendency is not to believe the observation. Therefore, a general malaise has taken root in the geophysical community when it comes to the many reported non-seismic and non-geodesic pre-earthquake phenomena. There seems to be no bona fide physical process by which electric currents of sufficient magnitude could be generated in crustal rocks.”

Freund makes an excellent attempt to explain all of the phenomena in terms of rock acting like a p-type semi-conducting material when placed under stress. Normally rock is a good insulator. For example, the emission of positive ions from the Earth’s surface may act as nuclei for the ground-hugging fog that sometimes occur prior to earthquake activity. And although the surface potential may only be in the 1–2-Volt range, the associated electric field across a thin surface layer can reach hundreds of thousands of volts per centimeter, enough to cause corona discharges, or “earthquake lights.” Thermal anomalies seen from space before an earthquake may be due to the emission of infra-red light where the semi-conductor charge recombines at the surface. Disturbed animal behavior may be due to the presence of positive ions in the air.

In the next excerpt theses researchers come to the same conclusion: 

Positive holes flowing through stressed igneous rocks

Akita Prefectural University, Japan
Electrical Engineering in Japan (Impact Factor: 0.1). 07/2009; 169(2):1 - 5. DOI: 10.1002/eej.20944

 Igneous rocks generally involve positive hole pairs (PHPs), a kind of lattice defects also known as peroxy links: O3X−OO−YO3 with X, Y=Si4+, Al3+, etc. When a portion of such a rock block is stressed or heated, PHPs are deformed and positive holes (p-holes) are activated. These are defect electrons corresponding to the O− electronic state in the O2− sublattice and can propagate into the unstressed portion. Currents and positive surface electrifications detected in laboratory stressed igneous rocks can be explained by the p-holes. When the p-holes are activated in the Earth's crust accompanied by seismic or volcanic events, they will lead to anomalous electromagnetic phenomena and could affect electronic communications. 

Why are aspects created by dividing the circle by 24 so important? 

Answer:That is the primary harmonic of the sun. The sun rings like a bell and the primary wave is every 15 degrees around it's circumference. See below. 

This shows how the earth acts like capacitor. The higher your altitude the stronger the current. 

How do the aspects work?

There are standing waves between each planet and the sun. It would seem that the 24th  harmonic, that is, the division of the 360 degrees of the circle by 24, or 15 degrees, is the prime vibration. When the planets make an aspect from the perspective of the earth, then the waves enhance each other and the effect grows. Vt=V1+V2. When the planets are half way between the various aspects the waves cancel each other out, Vt=V1-V2. As the thresholds of the breaking of the magnetic field lines acts in a similar manner to a zener diode the normal flow of electricity along the filed lines flows from the earth to the sun, as that is the dominant field. When the threshold is exceeded, like in a zener diode, there is a cascade in the opposite direction once it reaches the breakdown voltage. This usually occurs as the filed lines of the planets align and this creates the conditions for the breakdown voltage to be exceeded.  Overall this is how the sunspot cycle works as well. See the graphs below. 

The circuit below includes the source of electrical input from the outer galaxy and the galactic centre as the source to the right of the main circuit. It drives the basic system of the planets and the sun and is the prime mover of the changes seen in the sunspot cycle and the observed correlations with the climate changes.